Posts

Showing posts from March, 2017

Running the Experiment

Image
Hi everyone! The second week of data collection was a success! So far, I've gotten through about 60 people and I am on track to reach my goal of 90 participants. It's been pretty tiring running the experiment all by myself, but I am almost done with the experimental phase. As promised, I'll explain the changes I made to the procedure and how the first two weeks went down. Me trying to wrangle college students ( Image source ) First of all, I decided to do away with the control group , because I realized that the best method was to compare any changes in stress to a participant's baseline expectation: no change at all. It would be a waste of time to measure the differences in bio-data before and after five minutes of regular standing, as there would be no change in reported stress levels. After the first two attempts at obtaining control data, I was greeted with confused faces and disappointment at the lack of "cool VR tech to play with." Also, I deci...

Advertising

Image
Ad attempt #2 ( I  think I'm funny) Hi everyone! This week I started to run my experiment! I will be in the process of gathering data for the next three weeks, but I'll talk a little more about that in the next post. Today, I'm going to talk about the process of recruiting participants. The advertising process was a struggle. It proved to be much harder than I expected, because I didn't realize it would be so hard to get college kids out of their dorms. I started with a Powerpoint slide advertisement that would appear on Canvas, the program the students use to access their class assignments. Unfortunately, I heard that many students skim past announcements on the front page, so not many people signed up. Ad attempt #1 I realized my design was a bit boring and I modified it to be a little more ~eye-catching~ and appealing to the target population (see first image). Some people responded to the second version, but I ended up going up to several students...

Environment Selection

Image
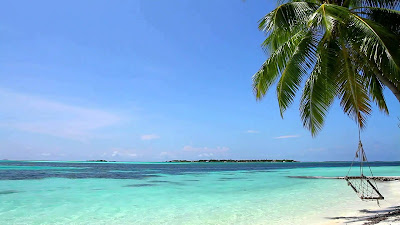
Image Source Hi everyone, This week, UAT was on spring break, so I didn't have a chance to go on campus. It was the last week to prepare for my experiment, so today I'll walk you through how I selected which virtual reality program to use with the HTC Vive. During the experiment, participants will be placed in one of three environments: Control: Regular waiting Exp 1: Virtual Reality  Exp 2: Interactive Virtual Reality An extremely detailed and advanced sketch I made of the three scenarios I designed the experiment to compare the effectiveness of  regular virtual reality immersion with an interactive, game-style virtual reality immersion. I wanted to study whether VR could be a viable tool for stress reduction, and if so, which method was more effective for escapism. Research has also shown that gaming can be a form of meditation that lowers stress over time, so I was intrigued to test it out.  To find the most relaxing VR environment, I did some r...

Recording Quantitative Data

Image
Image Source In order to obtain comparable data during the experiment, I needed to find a quantifiable way to assess anxiety levels.  Biodata: To gather comparable numbers, I plan to record the participants' heart rate and blood pressure before and after exposure to a VR environment. Both of these values are found to be possible indicators of stress, given that factors like strenuous activity aren't involved. I plan to use the p hotoplethysmogram on my phone for measuring heart rate variability, and an electronic blood pressure monitor for measuring blood pressure. Questionnaire: I also wanted to use a survey style that measured current anxiety levels, to get another layer of data. Since most of the valid questionnaires I found are meant for diagnosing anxiety, I decided to create my own Likert scale. In a Likert Scale,  " respondents specify their level of agreement to a statement," and it is  " the most widely used scale in survey research ....