Posts

Environment Selection

Image
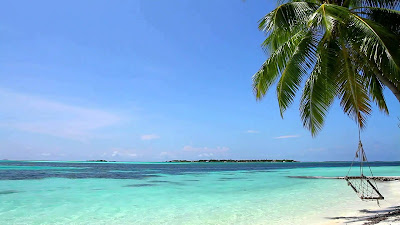
Image Source Hi everyone, This week, UAT was on spring break, so I didn't have a chance to go on campus. It was the last week to prepare for my experiment, so today I'll walk you through how I selected which virtual reality program to use with the HTC Vive. During the experiment, participants will be placed in one of three environments: Control: Regular waiting Exp 1: Virtual Reality  Exp 2: Interactive Virtual Reality An extremely detailed and advanced sketch I made of the three scenarios I designed the experiment to compare the effectiveness of  regular virtual reality immersion with an interactive, game-style virtual reality immersion. I wanted to study whether VR could be a viable tool for stress reduction, and if so, which method was more effective for escapism. Research has also shown that gaming can be a form of meditation that lowers stress over time, so I was intrigued to test it out.  To find the most relaxing VR environment, I did some researc

Leaving UAT and Getting Attention

Image
Hey everyone! Now that the majority of my research project is over, I'm focused on working on my final presentation (May 6th) and deliverable: a research paper. I  have mixed feelings about saying goodbye to UAT. On one hand, I'm glad I was able to complete my internship and get everything I needed for my research study; On the other hand, I've become so accustomed to showing up weekly that everyone has just accepted me as a student there, and it feels weird to not go! I've had a really fun experience learning how to run a research study, and I'm glad I was able to meet so many cool people. Although my research isn't exactly groundbreaking or official, I am pretty excited that I got noticed for it! The marketing specialist at UAT, Lauren Fach, reached out to me to write a blogpost about my research. It was featured on the UAT VR twitter , as well as on the UAT Tech Blog . UAT Twitter Lauren's Twitter UAT Tech Blog (Click HERE to view

Statistics and Results

Image
Hi everyone! I spent all of last week trying to figure out how to do my statistical analysis. (Image source) I walked into Mrs. Clark's (the AP Statistics teacher) room completely clueless. At first, she didn't realize I had no experience, and suggested I run several different fancy tests for significance and normality that I had never heard of. I must have had the most bizarre look on my face, because after 10 minutes of explanation, she finally asked, "Have you even taken stats before?" "Uhhhh nope." "OH...let's start over." Self-portrait  (Image source) RESULTS After three different sessions of learning statistics, I finally had a moderate understanding. I was able to run paired P tests and 2-sample tests to come to some conclusions: ✅ Based on the self-reported stress levels, VR (in both groups) was significant in reducing stress/anxiety ❌ In Group 2 (with controllers), the BP on average increased! Participants threw ro

Reaching 100!

Image
BREAKING NEWS I finished collecting data from 100 participants! Quick update this week: No one signed up for the last day of testing, but I went into super-researcher mode and gathered 17 new participants to meet my goal! Throughout the whole experience, I was able to meet many cool students and get to know the culture on campus. Here I am  (feeling like a real scientist) Here's a quick video compilation I made of participants experiencing VR technology, some for the first time: Now I will begin the statistical analysis of my data to see if any interesting trends pop up. We shall see whether or not VR with controllers made a difference in students' stress levels in a few weeks!

Running the Experiment

Image
Hi everyone! The second week of data collection was a success! So far, I've gotten through about 60 people and I am on track to reach my goal of 90 participants. It's been pretty tiring running the experiment all by myself, but I am almost done with the experimental phase. As promised, I'll explain the changes I made to the procedure and how the first two weeks went down. Me trying to wrangle college students ( Image source ) First of all, I decided to do away with the control group , because I realized that the best method was to compare any changes in stress to a participant's baseline expectation: no change at all. It would be a waste of time to measure the differences in bio-data before and after five minutes of regular standing, as there would be no change in reported stress levels. After the first two attempts at obtaining control data, I was greeted with confused faces and disappointment at the lack of "cool VR tech to play with." Also, I deci

Advertising

Image
Ad attempt #2 ( I  think I'm funny) Hi everyone! This week I started to run my experiment! I will be in the process of gathering data for the next three weeks, but I'll talk a little more about that in the next post. Today, I'm going to talk about the process of recruiting participants. The advertising process was a struggle. It proved to be much harder than I expected, because I didn't realize it would be so hard to get college kids out of their dorms. I started with a Powerpoint slide advertisement that would appear on Canvas, the program the students use to access their class assignments. Unfortunately, I heard that many students skim past announcements on the front page, so not many people signed up. Ad attempt #1 I realized my design was a bit boring and I modified it to be a little more ~eye-catching~ and appealing to the target population (see first image). Some people responded to the second version, but I ended up going up to several students

Recording Quantitative Data

Image
Image Source In order to obtain comparable data during the experiment, I needed to find a quantifiable way to assess anxiety levels.  Biodata: To gather comparable numbers, I plan to record the participants' heart rate and blood pressure before and after exposure to a VR environment. Both of these values are found to be possible indicators of stress, given that factors like strenuous activity aren't involved. I plan to use the p hotoplethysmogram on my phone for measuring heart rate variability, and an electronic blood pressure monitor for measuring blood pressure. Questionnaire: I also wanted to use a survey style that measured current anxiety levels, to get another layer of data. Since most of the valid questionnaires I found are meant for diagnosing anxiety, I decided to create my own Likert scale. In a Likert Scale,  " respondents specify their level of agreement to a statement," and it is  " the most widely used scale in survey research .&qu